A Visual Abstract is a brief summary of the key findings of an article, presented in a graphical format for easy uptake by readers. It gives the reader a quick overview of the main study findings at a glance, and helps them decide whether the paper is relevant to their interests. Such a representation of the study also allows for better dissemination of the article to a broad audience.
View the full Visual Abstract Gallery.
How does it work?
JMIR authors can choose to have a Visual Abstract created by a JMIR Publications in-house designer.
The Visual Abstract will be tweeted together with the paper (instead of the traditional non-text TOC image), will show up in the Table of Contents (TOC), and will be embedded in the paper.
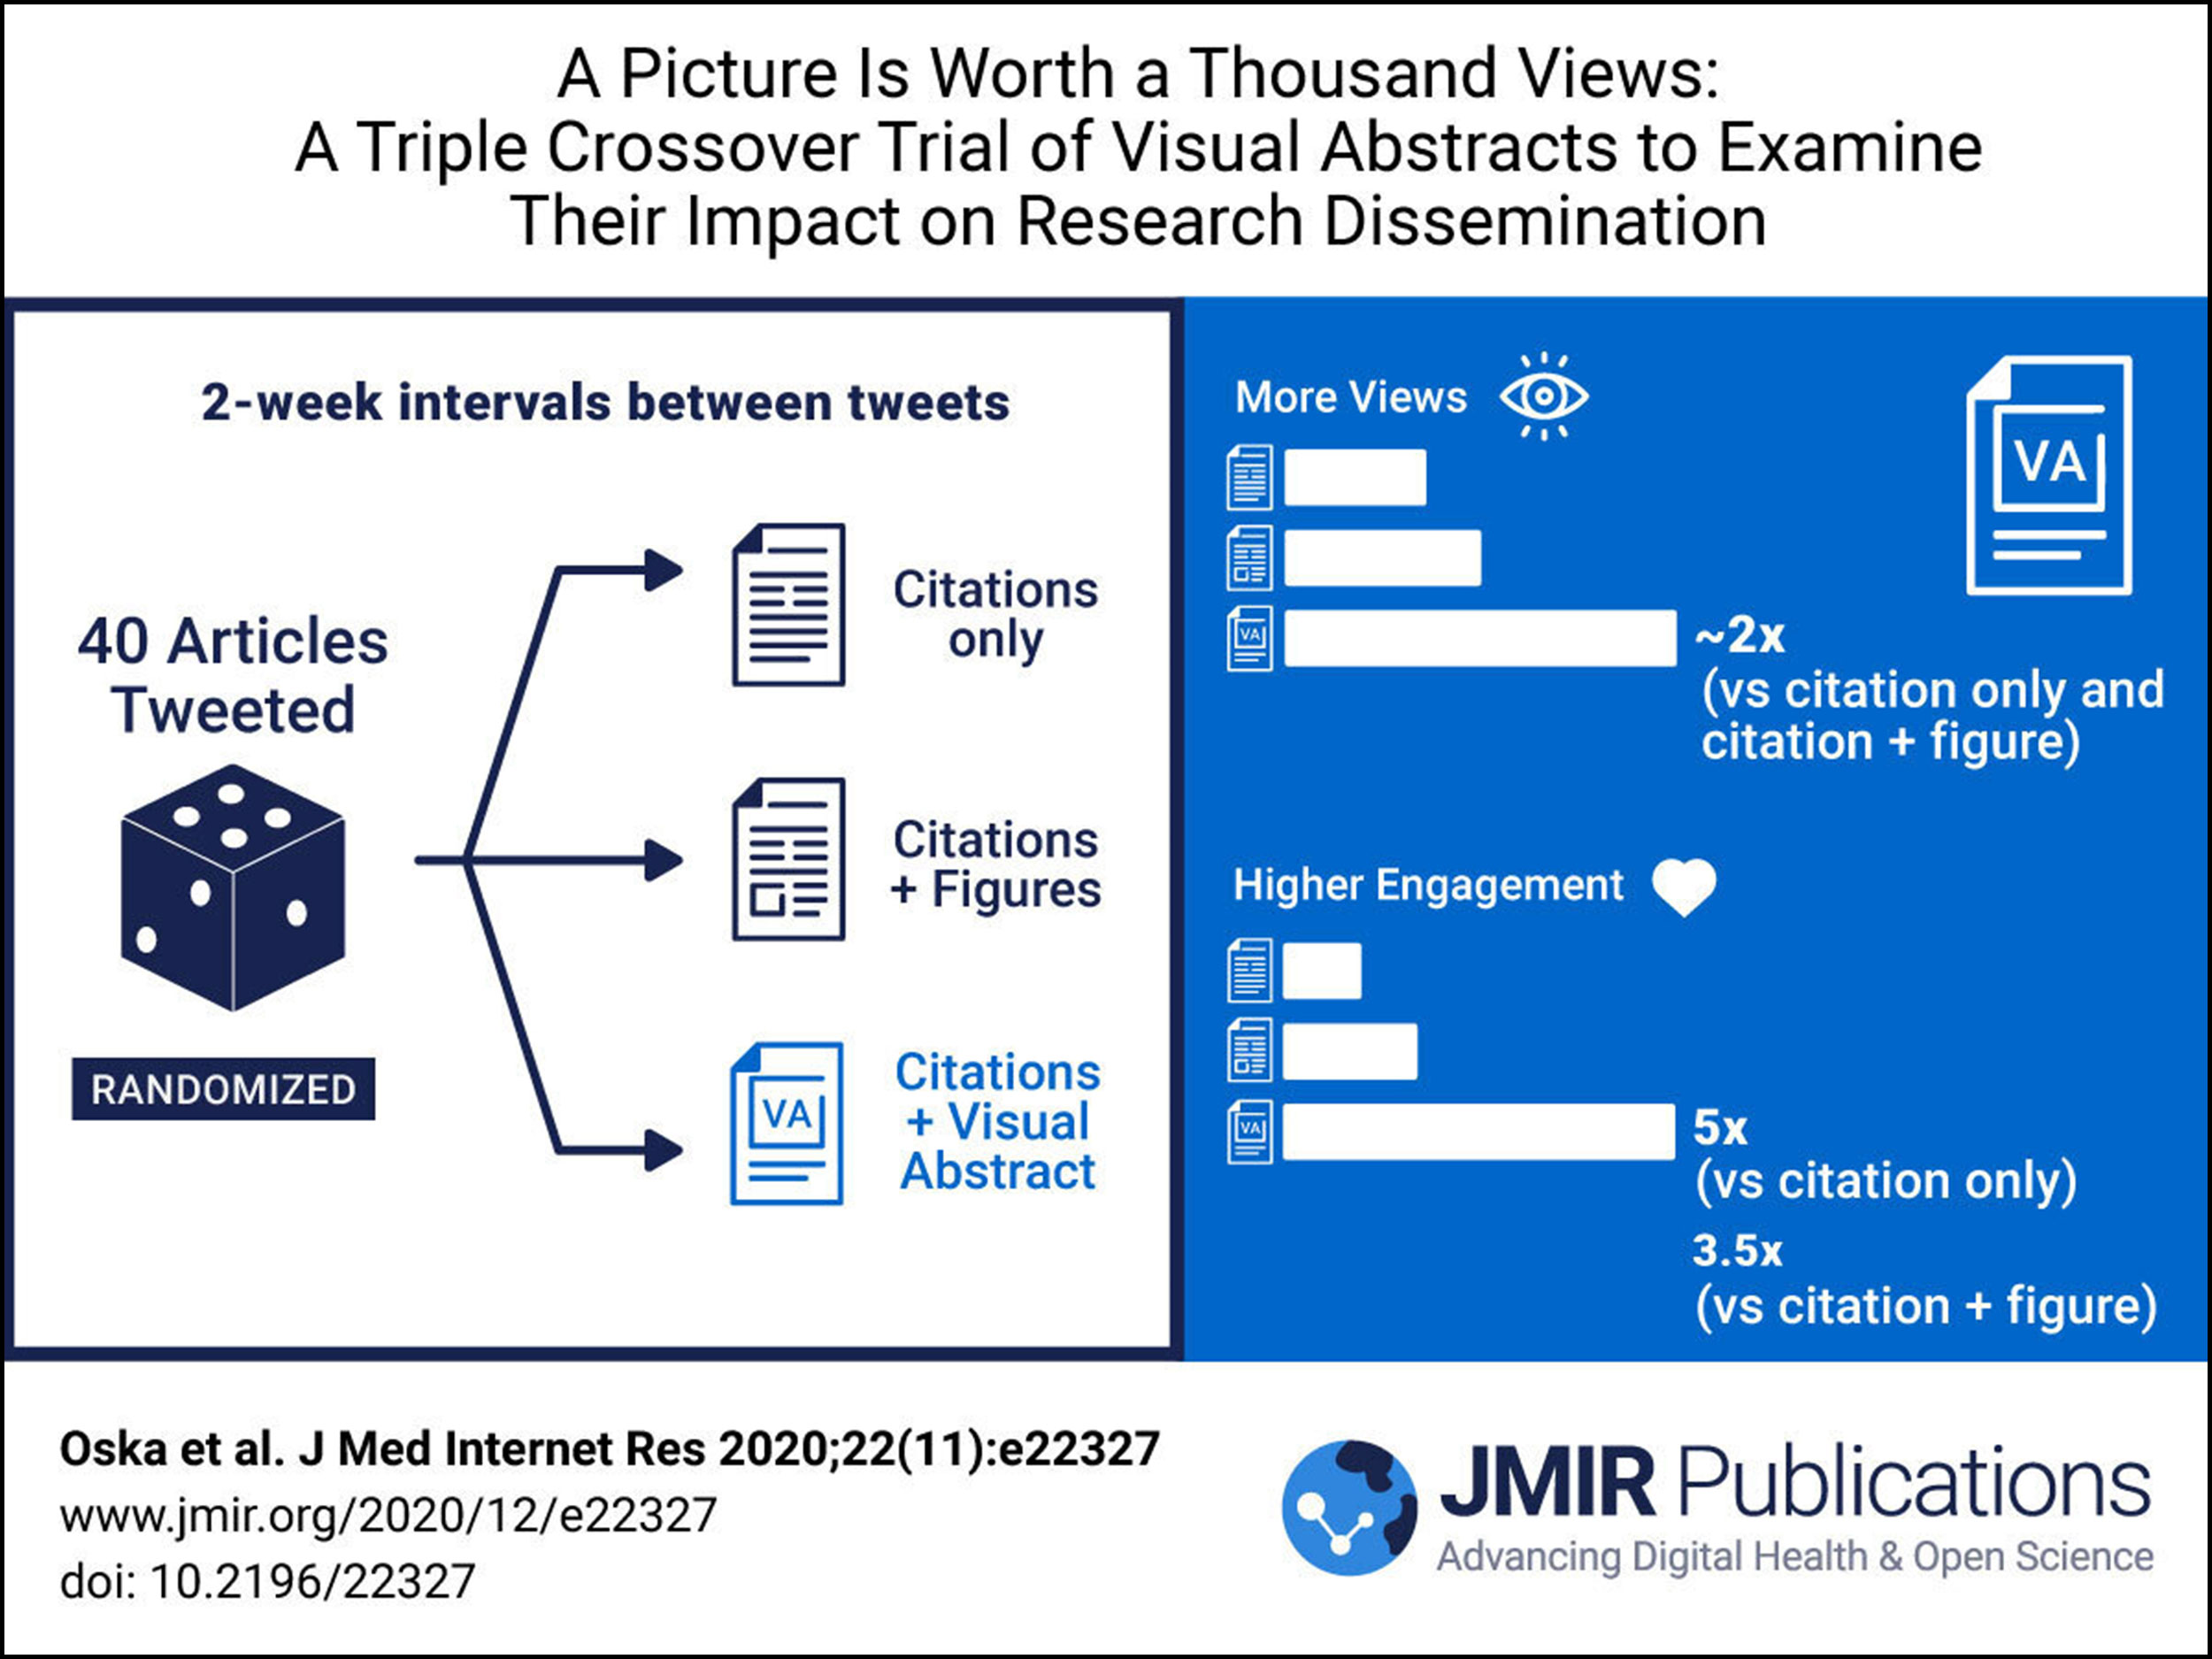
As all our knowledge translation tools, this is an evidence-based strategy that has been shown to enhance the impact of a publication, as shown in a recent RCT:
View this visual abstract on the journal page and on Twitter.
How can I opt in for this service?
This KT tool can be ordered when you check out and pay the APF for your article (see How can I order/pay for knowledge dissemination add-ons like TrendMD or sponsored Tweets?)
We recommend combining this option with our sponsored tweet service to further enhance dissemination.
Once you opt for our Visual Abstract service, we will reach out to you to understand the key messages you would like us to convey in the visual abstract, so that our designers can help bring your ideas and vision to fruition.
Examples of visual abstracts published in JMIR Publications:
View this visual abstract on the journal page.
View this visual abstract on the journal page.
View this visual abstract on the journal page.
Related:
Comments
0 comments
Article is closed for comments.